|
Differential
Thermal Analysis (DTA) is a "fingerprinting"
technique that provides information on the chemical reactions, phase
transformations, and structural changes that occur in a sample during
a heat-up or a cool-down cycle. The DTA measures the differences in
energies released or absorbed, and the changes in heat capacity of
materials as a function of temperature.
All materials behave in certain, predictable ways when exposed to
certain temperatures, so the resulting DTA curve is an indication of
the materials and phases present in the sample. For example, the DTA
is used to indicate the relative magnitude of reactions and phase
transitions of ceramic materials or batches that can be destructive so
that safe drying and firing schedules can be determined. The DTA
identifies the temperature regions and the magnitude of critical
events during a drying or firing process such as drying, binder
burnout, carbon oxidation, sulfur oxidation,structural clay collapse,
Alpha to Beta quartz transition, carbonate decompositions,
reggcrystalizations, melting and cristobalite transitions. A DTA of a
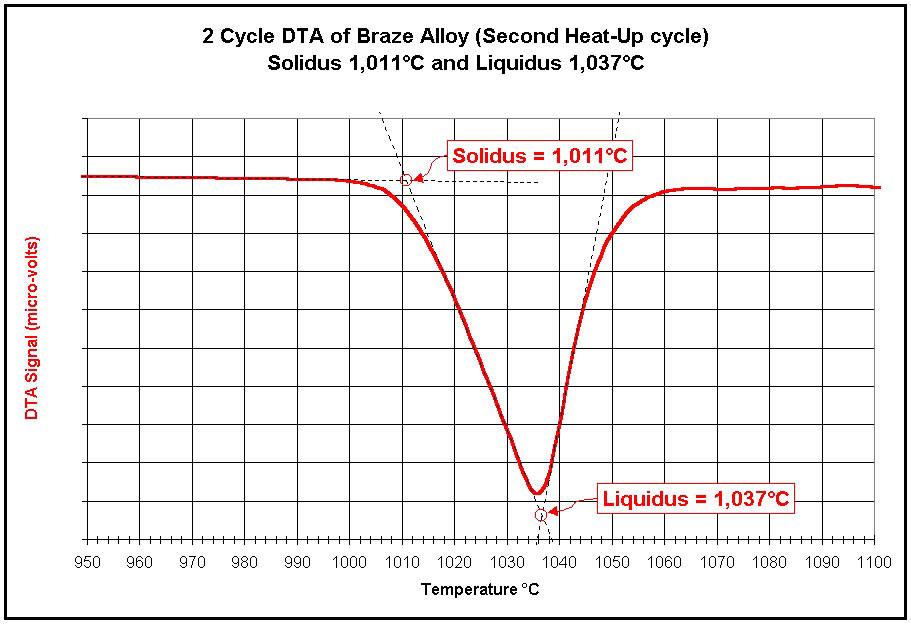
solder or braze alloy will indicate the solidus and liquidus
temperatures of that alloy.
A. Characteristics or Properties Measured
Drying, decomposition, oxidation, sintering, phase transformation,
devitrification, recrystalization, melting or liquidus temperature,
solidification or solidus temperature, glass transition temperature (Tg),
curie point, energy of reaction, and others.
Examples of Applications
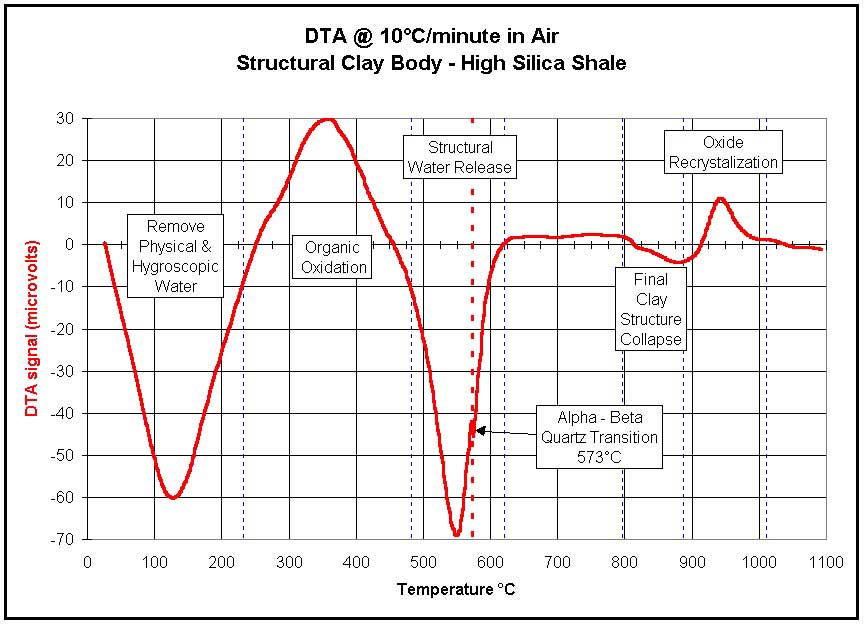
The test results are a graph of the DTA signal (microvolts) on the
Y-axis plotted versus the sample temperature in ¡ÆC on the X-axis.
Sample graphs of enhanced output are shown below.

Ceramics-Clay Analysis |

Metals-Solidus/Liquidus Determinations |
¡¡
| Range of Test Conditions: |
- Room Temperature to +1,600¡ÆC
- Ambient, Inert, and Reducing
Atmospheres
- Simple Heat-up and Cool-down,
Multiple Cycles, and Programmed Thermal Cycles
- Sample Size - 150 mm©ø
|
|
B. Standard Orton DTA Instruments & Specifications
|
 |
| |
Model DT-732 |
Model DT-736 |
| Temperature
Range |
20¡ÆC to 1,200¡ÆC |
20¡ÆC to 1,600¡ÆC |
| Sensitivity |
1 micro-volt |
1 micro-volt |
| Differential
Thermocouple |
Type
"S" |
Type
"S" |
| Sample Cup |
Boersma Design,
High Alumina |
Boersma Design,
High Alumina |
| Sample Volume |
10 to 250 mm©ø |
10 to 250 mm©ø |
| Atmospheres |
Air, Inert,
Reducing, Vacuum |
Air, Inert,
Reducing, Vacuum |
| Temperature
Control |
Muli-segment
PID Controller, Phase-angle fired SCR's |
Muli-segment
PID Controller, Phase-angle fired SCR's |
| Power
Requirements |
120 VAC, 15
amp, 50/60Hz (240 VAC avail.) |
120 VAC, 15
amp, 50/60Hz (240 VAC avail.) |
| DTA Module
Dimensions |
18¡± W x 12¡±
D x 25¡± T (460 x 305 x 635 mm) |
18¡± W x 12¡±
D x 25¡± T (460 x 305 x 635 mm) |
| Control Console
Dimensions |
18¡± W x 12¡±
D x 5¡± T (460 x 305 x 130 mm) |
18¡± W x 12¡±
D x 5¡± T (460 x 305 x 130 mm) |
*Descriptions
and specifications are subject to change without notice.
Other sample cup designs
are available. All Orton dilatometers are supplied with data
acquisition and analysis software for computer display, storage and
data analysis.
C. Additional
Information on DTA
| Principle of Operation |
 |
DTA measures the
temperature difference between a reference material and the sample
during a heat up or cool down. The temperature difference is an
indication of the type of event that is occurring in the sample, and
its magnitude.
A sample of the test material is placed into a special shape cup so
the test material surrounds a thermocouple bead. The cup is made from
a sintered, high purity alumina, which is relatively inert to the test
sample. An identical cup (the reference cup) is filled with an inert
material (powdered, high purity alumina) and is placed immediately
beside the sample cup. When both cups are uniformly heated at a
constant rate, the increasing temperature must pass through the
materials in the cups in order to raise the temperature of the buried
thermocouple beads. The "DTA signal" is the difference in
temperature between these two thermocouple beads while the sample cups
are heated, and is constantly saved on the computer along with the
temperature inside the reference cup and the elapsed time.
The DTA curve plots the
"DTA signal" in microvolts on the Y-axis  against
the reference material temperature on the X-axis. If nothing is
occurring in the sample material and the reference material (the
reference material has been carefully selected so no reactions or
transitions occur throughout the test temperature range) , the heat
will pass through both materials at the same rate and raise the
temperature of both thermocouple beads at the same rate. The
difference between the two thermocouple temperatures is zero, so a
flat line is generated. against
the reference material temperature on the X-axis. If nothing is
occurring in the sample material and the reference material (the
reference material has been carefully selected so no reactions or
transitions occur throughout the test temperature range) , the heat
will pass through both materials at the same rate and raise the
temperature of both thermocouple beads at the same rate. The
difference between the two thermocouple temperatures is zero, so a
flat line is generated.
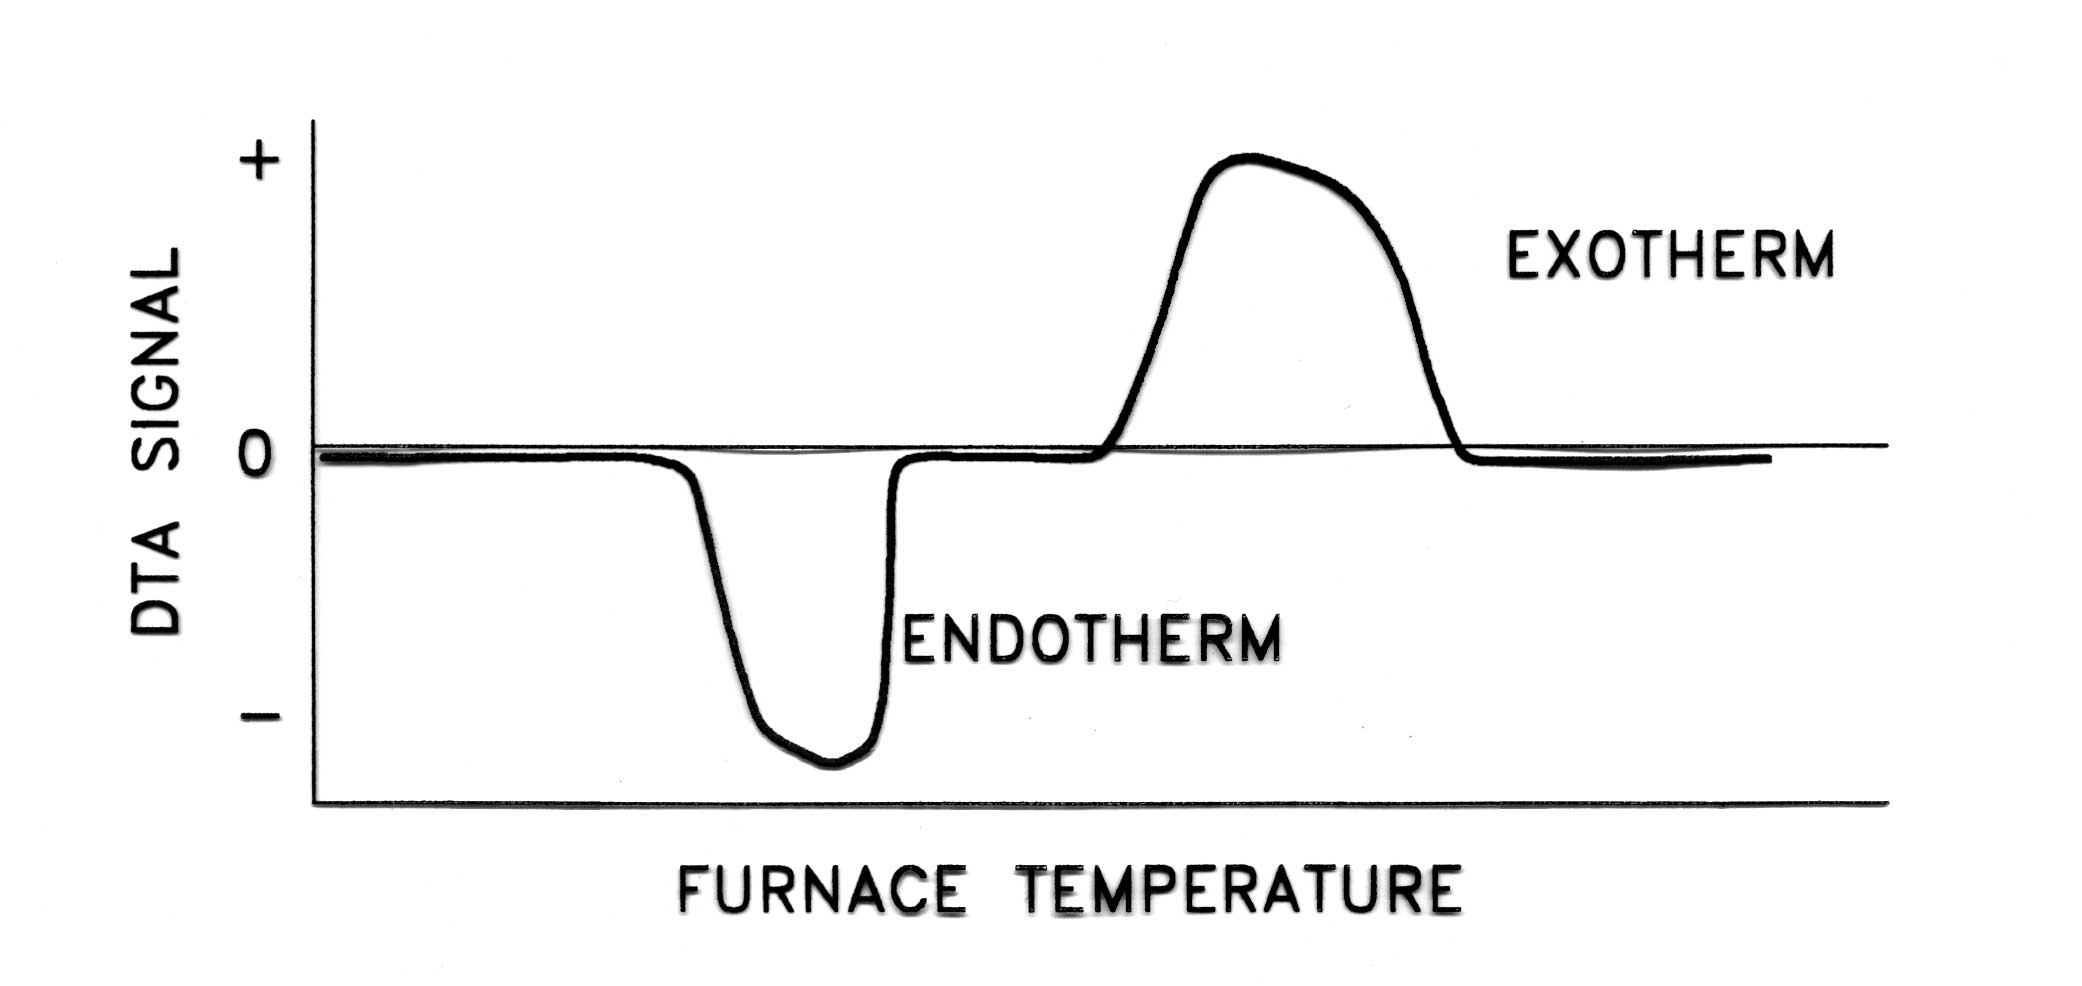
Endothermic Reaction
An endothermic reaction is a chemical reaction that must absorb a
certain amount of energy in order to proceed to completion. When an
endothermic reaction is encountered, the temperature of the material
remains constant while the energy is absorbed. The thermocouple bead
inside the material remains at the same temperature, even though the
temperature outside the cup is rising. Meanwhile, no reactions or
transitions are occurring in the reference material, so the
temperature of the reference material continues to rise. The
differential signal between the sample and reference thermocouples
becomes negative, and the DTA curve drops. Once enough energy is
absorbed and the endothermic reaction is complete, the temperature of
the sample material quickly rises to catch up with the reference
material. The resulting temperature differential reverses back to
zero, and the DTA curve rises back to an equilibrium position. This
endothermic reaction creates a "valley" in the DTA curve.
The depth and breadth of this valley is an indication of the
magnitude, temperature range, and speed of the reaction.
Exothermic Reaction
An exothermic reaction is a chemical reaction that releases a certain
amount of energy upon its completion. When an exothermic reaction is
encountered, the temperature of the material quickly rises above the
outside temperature, and the thermocouple bead inside the material
quickly rises above than the temperature outside the cup. Meanwhile,
no reactions or transitions are occurring in the reference material,
so the temperature of the reference material continues to rise, but
not as fast as the sample material. The differential signal between
the sample and reference thermocouples becomes positive, and the DTA
curve rises. Once the exothermic reaction is complete, the temperature
of the reference material quickly catches up. The resulting
temperature differential reverses back to zero, and the DTA curve
drops back to an equilibrium position. This exothermic reaction
creates a "peak" in the DTA curve. The depth and breadth of
this peak is an indication of the magnitude, temperature range, and
speed of the reaction.
D. Frequently Asked
Questions:
Temperature:
Standard tests range from ambient temperature up to 1,600¡ÆC.
Atmospheres: Tests are normally
performed in ambient air. Inert atmospheres can be used. If reducing
or reactive atmospheres or vacuums are required, the Model DT-720
series DTA is required. See Orton for details.
Thermal Cycle: Most DTA tests are
performed at a standard heating rate to the maximum temperature, then
discontinued. The thermal cycle can be extended to include the cooling
data. Other thermal cycles that contain multiple ramps and soaks, or
multiple cycles (for solidus/liquidus determinations) are easily
programmed by the user with the multi-segment controller that is
supplied with the system as standard.
Heat-up Rate: Most DTA samples are
normally heated from ambient to the maximum temperature at 10¡ÆC per
minute. Other heat-up rates can be used. Faster heating rates are used
to capture reactions that occur quickly. Fast heating rates generate
deeper valleys and higher peaks, and will shift the onset temperature
above the actual. Slower heating rates may miss fast and minor
reactions. Slow heating rates generate shallower valleys and lower
peaks, but will display the onset temperature closer to the actual.
These various heating rates are are easily programmed by the user with
the multi-segment controller that is supplied with the system as
standard.
Sample Size: The sample cup holds
approximately 150 mm©ø of fine powder or liquid.
Sample Cup: The standard sample cup
supplied with the system is a Boersma style cup made from a fine
grained, dense, high purity alumina. A cross section sketch of the cup
is shown in the "Principle of Operation" section above. The
Boersma design allows the sample and reference materials to surround
the thermocouple beads without contacting the beads. This protects the
thermocouple beads from contamination. Orton has other cup designs if
desired. The high alumina was selected due to its non-reactive nature
with most materials at elevated temperaures. If the high alumina is
not a desirable cup material, other materials such as platinum are
available.
Sensitivity: The output of a type
"S" thermocouple at 1,000¡ÆC is 9.587 milli-volts (9,587
micro-volts), and at 1,010¡ÆC is 9.703 milli-volts (9703 micro-volts).
The output difference for only 1¡ÆC is 11.6 milli-volts, or 11.6
micro-volts. With a sensitivity of 1 micro-volt, the DTA with a type
"S" differential thermocouple is capable of discerning a
temperature difference between the sample and reference material of
0.08¡ÆC. For testing temperartures less than 1,200¡ÆC, a type
"K" or type "N" differential thermocouple can be
used for increased sensitivity. The output of a type "K"
thermocouple at 1,000¡ÆC is 41.276 milli-volts (41,276 micro-volts),
and at 1,010¡ÆC is 41.665 milli-volts (41,6653 micro-volts). The
output difference for only 1¡ÆC is 389 milli-volts, or 38.9
micro-volts. With a sensitivity of 1 microvolt, the DTA with a type
"K" or type "N" differential thermocouple is
capable of discerning a temperature difference between the sample and
reference material of 0.025¡ÆC.
DSC versus DTA: See the next section for
a more complete discussion.
| Comparing the DTA versus the DSC |
| DTA |
DSC |
| 1. Provides the same
information as the DSC. |
1. Provides the same
information as the DTA. |
| 2. Larger sample size - for
ceramics and metals that require larger amounts to insure
sample homogeneity. |
2. Small sample size -
ideal for polymers, petrochemicals, pharmaceuticals, etc.
where sample homogeneity is not a concern. Ceramic materials
require averaging the results from several runs to insure
homogeneity. |
| 3. Larger thermal mass
furnaces to insure isothermal conditions for samples, slower
sample turnaround. |
3. Smaller thermal mass
furnaces that provide rapid sample turnaround. |
| 4. Less complicated system,
and lower priced than the DSC. |
4. More sophisticated, more
complex, and more expensive. |
DSC
DTA (Differential Thermal Analysis) and DSC (Differential
Scanning Calorimetry, by the way, there are two versions) are
thermoanalytical techniques that reveal the same information about
materials, but use different methods to determine that information.
They provide the same information on how a specimen ¡°got from here
to there¡± (the chemical reactions, phase and structural changes, and
energies of reactions and changes) during a heatup or cool down cycle.
Although the output traces of the DSC¡¯s and DTA are visually
similar, the operating principles are very different.
The DSC was developed for quickly and automatically analyzing the
energies of reactions of low temperature materials such as polymers,
petrochemicals, and pharmaceuticals. These types of materials are
extremely uniform, so small sample sizes are homogeneous and the
results are reliable. Ceramic materials are not as homogeneous, so
sample sizes that are larger than DSC cups can accommodate are
desired.
There is some confusion concerning DSC¡¯s. Perkin-Elmer markets the
only ¡°power compensated¡± DSC, and is patented. TA, Netzsch, and
others, provide a ¡°heat flux¡± DSC, which is based on the DTA
principle.
DSC (heat flux) is a more sophisticated version of DTA, which measures
the temperature difference between a reference material and the sample
during a heat up or cool down. The temperature difference is an
indication of the type of event that is occurring in the sample, and
its magnitude.
DSC (power compensated) measures the amount of electric energy
required to maintain equal temperatures of the reference material and
sample during a heatup or cool down. The electrical energy required is
an indication of the type of event that is occurring in the sample,
and its magnitude.
For the power compensated DSC there are separate containers for both
sample and reference materials. Each container has its own heating
element and temperature measuring device. The heating element and the
temperature measuring device are discs with imbedded platinum coils
that are separated by a thin electrically insulating wafer.
Temperature is determined by a platinum resistance thermometer (RTD)
which measures the resistance of the platinum as a function of
temperature. The sample and reference chambers are heated equally
until some reaction or change occurs within the sample material. As
the temperature of the sample material infinitesimally deviates from
the reference material temperature, the heat input to one container is
decreased and the heat input to the other container is increased to
maintain a zero temperature difference between the two containers.
This is referred to as a ¡°null balance¡± technique. The quantity of
electrical energy per unit time that is supplied to the heating
elements to maintain this null balance (over and above the normal
thermal schedule) is assumed to be proportional to the heat release
(exothermic reaction) or heat absorbed (endothermic reaction) by the
sample. The DSC curve is expressed in Watts (energy per unit time) as
the Y-axis plotted against the sample temperature as the X-axis.
This power compensated DSC has two control cycle portions. One strives
to maintain the null balance between the sample and reference
material, and the other strives to maintain the desired test heat up
or cool down rate. These processes switch back and forth continuously
to maintain both portions simultaneously.
For rapid cooling, both sample and reference cells are surrounded by a
cooling jacket.
To maintain good thermal contact for rapid system response, the sample
chamber and sample size must be small.
DTA
The DTA is a "passive" system, that is the material is
simply heated and the differential thermocouple output signal is saved
for post testing analysis. For ceramic materials, the DTA is a far
simpler, and less expensive instrument that generates the same
information on a larger sample in one test.
¡¡ |